Since our recession call in March, we have received a fair number of questions about how and why. To give a clearer picture of our view, and on our services, we are publishing the majority of the Forecasting -section of the June 2019 issue of our Q-Review, normally reserved for our subscribers.
Our forecasts are based on scenarios. We always have three of them: Optimistic, consensus (most likely) and pessimistic. We present just the consensus forecast in the Q-Reviews, while the other are presented in our monthly Deprcon outlooks.
But, without further delay, here’s our current view.
The background of forecasts
China started to scale-back its fiscal and monetary stimulus in the first half of 2018. The main goals were to deleverage and rein-in the shadow banking sector. Global central bank balance sheets in aggregate started to decline in August/September. The decline in global liquidity triggered an abrupt and sharp decline in stock markets during the fourth quarter of 2018. In December, Chinese authorities panicked and injected record amounts of liquidity into their banking system. Because of the PBoC actions, the global central bank balance sheet immediately reversed to back to growth.
During the first months of 2019, China again forced record amounts of credit into its banking system, resulting in record aggregate financing to the Chinese economy. This included around $320 billion for infrastructure projects, and over $300 billion worth of tax-cuts, raising the budget deficit to 2.8 percent of GDP for the fiscal year. Notably, this record stimulus has barely kept the economy growing above the “official rate”. This implies that the effectiveness of debt-stimulus model to create economic growth in China has declined considerably (see, e.g. Q-Review 3/2017). And because the stimulating effect of President Trump’s tax breaks has also started to wane, there will be rough water ahead for the global economy for the rest of the year.
The Fed, effectively, has just two “bullets” left: interest rate cuts and restarting QE. However, their effectiveness in resuscitating the economy is likely to be limited as both the long- and short-term interest rates are already at low levels. Recently, Fed communications have been preparing market participants for a new policy: pre-emptive market bailouts. Effectively, it’s what other central banks have been doing for a long time (see, e.g., Q-review 4/2018). The idea is to prevent any potentially-cataclysmic market event from gaining momentum in the first place by aggressive Fed pre-emption. The strategy may seem logical, but it has one massive flaw: business cycles and recessions will occur regardless of the activities of central banks (see, e.g., Q-Review 1/2019). This implies three things. First, an asset bubble may be inflated until it becomes unsustainable (recession arrives). Secondly, when recession arrives, the decline in manipulated asset markets is likely to be unstoppable as negative pressures in the stock and bond markets overwhelm central bank responses. Third, when asset markets crash, they are likely to push the economy from recession into depression (see Q-Review 4/2018).
In May, the trade dispute between China and the U.S. flared-up again, possibly hastening the end of the current business cycle. Although we have not written about the trade dispute in Q-Reviews, we have kept a close eye on it. […] The trade dispute may very well be the “trigger” that pushes the global economy onto the path to global depression. We estimate that probability that the trade war will escalate (will not be resolved quickly) is 60%.
If China, for whatever reason, enacts another round of massive debt-driven stimulus, it may help for a while, but it will not save the Chinese economy from an impending recession and a hard-landing. Although the combined efforts of the Fed, other central banks, and the PBoC could stave-off the onset of a recession, this would be short-lived for two reasons. First, the ability of China to generate economic growth through debt generation is most likely to be completely gone within two years—if not already. Alas, by 2021—2022 at the latest—the Chinese economy is likely to crash, if the debt machine is kept running in overdrive until the bitter end—when its effectiveness to stimulate growth is totally lost. Secondly, central banks have few options to provide further stimulus and the effectiveness of further stimulus is likely to be limited, in any case.
So the simple answer to the question: “how long can global central authorities keep this up?” is “until recession arrives.” So, when does the recession finally hit?
Timetable for the recession
According to the academic literature, the 10yr-3mo yield (US Treasury minus T-bill difference, or the “spread”) is a very reliable recession predictor. This applies especially now, as the Fed holds, through its asset purchase program, mostly Treasuries with maturities ranging from 1 to 5 years. Historically, recession has followed 9-17 months after the inversion. Yield-curve inversion also affects the profitability of banks, as they “borrow” (interest on deposits) in short maturities and lend in long-maturities (loans). Yield-curve inversion can thus become a “self-fulfilling prophecy”, because it diminishes the profitability of banks and forces them to tighten their lending standards. The 10yr-3mo yield-curve first inverted in March, then steepened and re-inverted mid-May. As of time of writing, the 10yr-3mo curve is the most inverted since May 2007. As an indication of this, the share of US banks tightening the conditions of consumer loans and credit cards has already risen to the highest level since 2009.
The leading indicators indicate that the global downturn started already around a year ago (see the Figure). The indicators of the euro area, Germany and the US have been in decline for months or even over a year (in Germany). The indicators in China started to fall in late 2017 (see Q-Review 3/2017). The record stimulus earlier this year also shows up nicely in the series. Like mentioned above, it has not continued during the past two months (April and May). The uptick in the indicator is thus likely to be temporary.
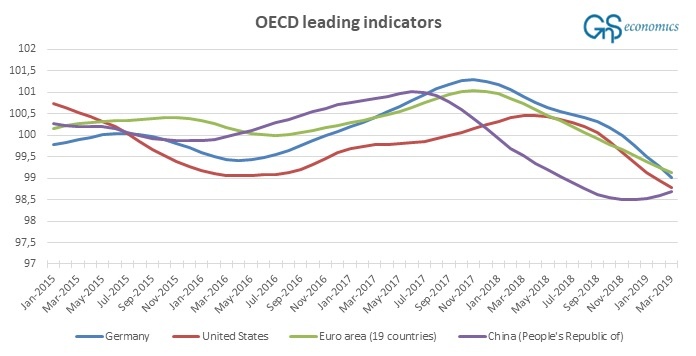
Figure. The amplitude adjusted composite leading indicator of the OECD for China, Germany, euro area and the United States. Source: GnS Economics, OECD
Now, if we assume that China will not turn stimulus back up, and the Fed will not pre-emptively cut interest rates, recession is likely to start in the Eurozone in Q4 this year. The US would follow in Q1 2020. If asset markets in the US start to crater earlier, it is likely to hasten the onset of the recession in the US as well.
However, if China ramps-up debt stimulus back to record levels and if the Fed starts to cut rates, with other central banks providing concurrent support (by, e.g., restarting/hastening QEs) the onset of a recession would, most likely, be postponed for few quarters. But let us be clear. If such desperate actions are taken, it would all but guarantee an extreme outcome in the coming crisis. This is for the simple reason that all the standard stimulus options would have been completely exhausted.
Growth forecasts
In Table 1, we present the nowcasts and the growth forecasts for the real GDP of the United States, Eurozone and Finland under the most-likely scenario (global depression). We assume that China will mildly ramp up stimulus during Q3, which will keep the global economy from imploding completely. We also assume that the Fed will cut interest rates in the fall to support the economy. These measures will only offer temporary and inefficient relief. Alas, we assume that the worsening global economic picture will crash the asset markets during Q4 this year. This will set in motion the global depression in 2020.
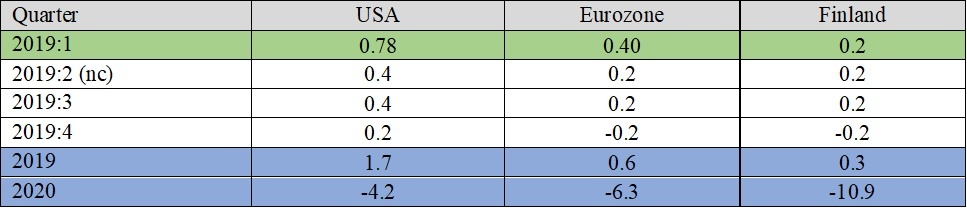
Table. Nowcasts (nc) and forecasts for the growth rate of real GDP in the US, Eurozone and Finland under consensus scenario. Source: OECD, Bureau of Statistics and GnS Economics.
According to our forecasts, the US economy will grow by 1.7 percent this year, the Eurozone will grow by 0,6 percent and Finland 0.3. In 2020, real GDP will decline by over four percentage points in the US, over six percent in the Eurozone and over ten percentage points in Finland. These forecasts, however, depend heavily on the assumptions presented above.
Full report
The full report including guidelines for investors for crisis preparation, full forecasts, crisis probabilities and historical examples can be bought fromGnS Store
The Annual Subscription of Q-Review reports is available fromGnS Store